Shock Forces
Reading Shock Dyno Plots
The shock dyno is a device for measuring the performance of shocks. The usual model consists of an electric motor connected to a Scotch yoke mechanism, which converts the rotation of the motor into a pure reciprocal sine wave. The shock is connected to the yoke and a load cell, and the motor has a position encoder in it so it knows the position of the shock relative to time. Having position, time, stroke, and force allows you to see the performance of the shock in terms of force/position, force/velocity, and force/acceleration.
There is a little bit of artificiality with the shock dyno because the input to the shock is a sine wave, but in the wild the input is considerably more complex. There are much more sophisticated dynos out there that can produce arbitrary waveforms (and even play back data recorded from the track) but they are very expensive and so very few places have them. You'll be lucky to find a shock vendor with a sine wave dyno, never mind one of the good ones.
The situation is analogous to the Dynojet chassis power inertial dyno. Because the engine on a Dynojet accelerates a 2700lb drum instead of the exact load the engine would see accelerating the actual car (especially if the car is much heavier or lighter than the inertial drum), the power number the dyno spits out may not exactly match the power the engine is capable of producing out on the track. But like the Dynojet, the data provided is still very useful even if it doesn't match the "live" data exactly. For all intents and purposes, you can trust a sine wave dyno to give good data.
Once the data has been collected, the dyno software can present it in one of three basic plot formats:
- Force/Position (otherwise known as the "football");
- Force/Velocity; and
- Average Force/Velocity.
Let's look at each one:
Force/Position
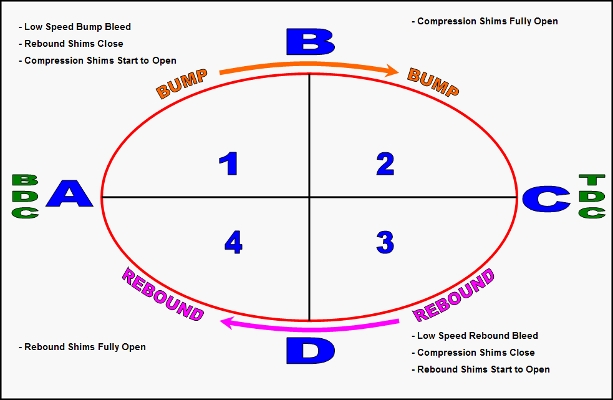
The "football" is very good for showing where in the shock's stroke various things happen. It helps isolate force changes due to shimstacks opening and closing, bleeds topping out, seals sticking, cavitation, and whatnot. Accordingly, it is most helpful when trying to build a shock or diagnose a wonky one. It is not particularly useful from a tuning perspective though, as we care more about shock force as a function of velocity.
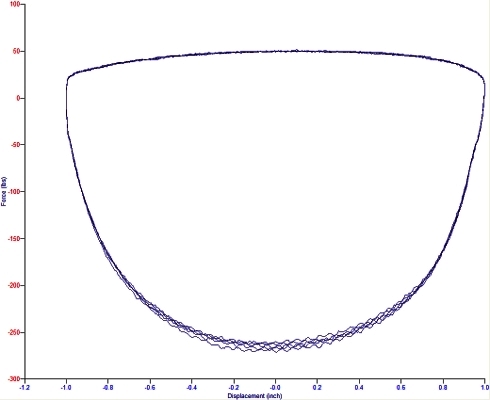
Here is a football from a Koni Yellow:
Force/Velocity
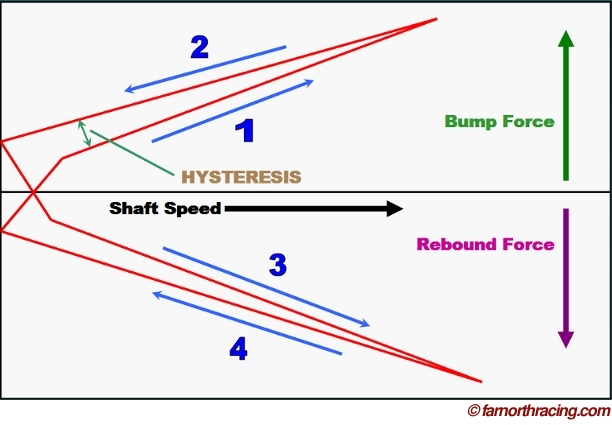
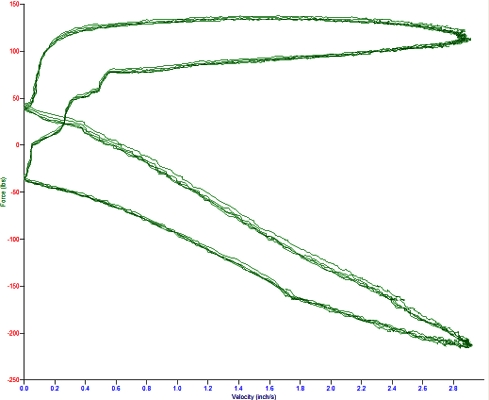
The Force/Velocity graph is the most useful for determining shock quality. A well constructed shock will produce a trace with very little hysteresis gap between the "bump-accelerating" and "bump-decelerating" (and "rebound-accelerating/rebound-decelerating for that matter) portions of the trace. No shock is ever perfectly on the same force (no gap) but you want it as narrow as possible.
This is the same Koni Yellow data from the football, displayed as Force/Velocity:
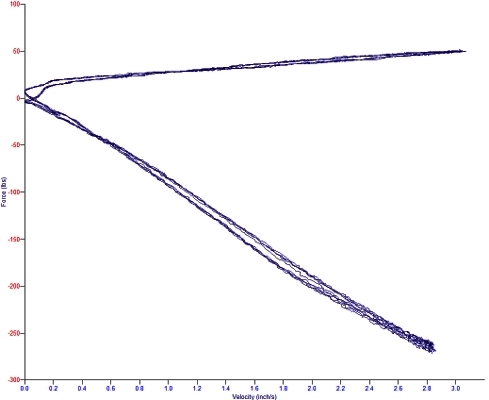
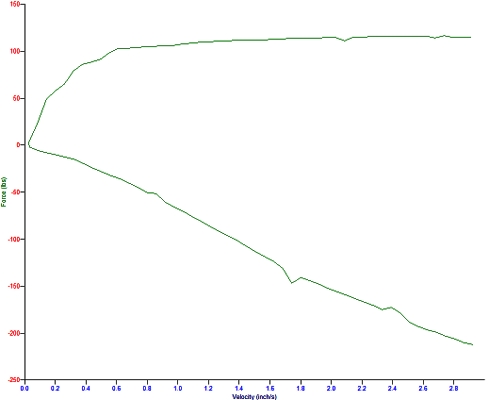
As you can see, this is pretty good. Compare to an unnamed shock of a supposed advanced design (also brand new - and way more expensive too):
Where the Force/Velocity plot is not as useful is for determining forces for use in dynamics calculators and changing valvings. The "loop" in the plot makes it hard to see force changes when you start overlaying traces on top of each other - more than about two traces and it becomes unreadable.
Average Force/Velocity
The Average Force/Velocity plot takes the F/V "loop" and for each velocity data, averages out the accelerating and decelerating forces to produce a single line.
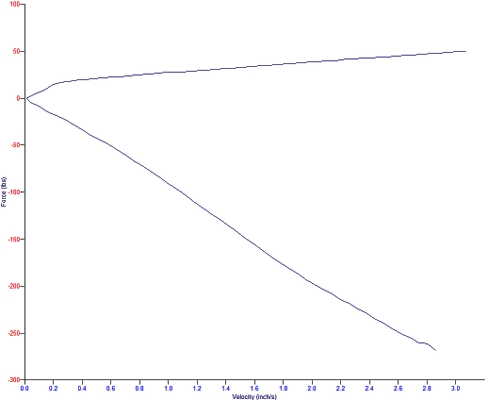
This plot is useful for comparing shocks to each other, looking at the effects of adjusters or valving changes, and matching shocks left to right. As long as the hysteresis gap on the FV plot is narrow, the AFV plot is perfectly valid for these uses. Beware, however, shocks with crappy FV plots, because the FAV plot will hide the shock's faults:
The little hitches and kinks in this AFV plot are clues to check out the FV plot to see what is going on.
Don't get fixated on the AFV plot - don't forget to check the FV plot to make sure the shock's behaviour is reasonable and the AFV plot is representative.
Once you have determined that the AFV plot is valid, you can use the data as inputs to dynamics calculators to see what percent of critical the shock forces are, and how well that matches a 65% critical "ideal" force curve.
Learned something?
Help keep ATW online!