Analyzing the 2002 South Course
There's an old saying in racing with regards to technical development: "If you're not going forward, you're going backwards"
This is especially true in a car-development class like Street Modified, where the freedom within the rules to modify the car means that there are always places to find technical improvements.
The aim, then, is to identify areas where the car (and potentially, driver) are not performing to expectations, and then improve those areas.
However, autocross, and especially the amateur-format events where you only get three runs per course, is notoriously difficult to analyze, as the driver isn't given the luxury of lap after lap of continuous running to form opinions about how the car is handling. Furthermore, what driver opinions can be gleaned during events are often heavily coloured by the pressures of the competitive environment. When a National Championship is on the line, it can be difficult to provide the kinds of objective analysis required for car development.
Increasingly, then, the chassis data logger is becoming a major source of developmental data.
Nationals 2002 provided a surprise, in that the South Course was much tighter, and had a slower average speed, than courses presented in previous National events. Although the driver (that would be me) had a reasonable day in terms of performance, car and driver were off the class leading pace. The question that needs answering is "Why?" and so we go to the chassis logger for answers.
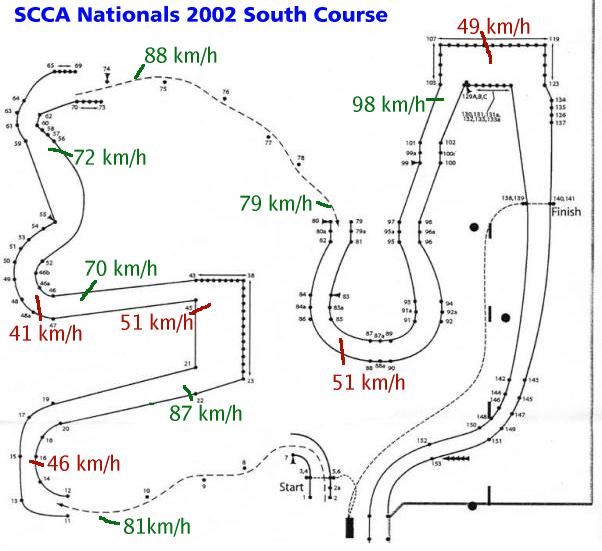
Below is the South Course track map, with the speeds taken from the best run plotted on it.
And this is a screen shot of the data logger overlaying the best run (run 2) with the second-best run (run 1)
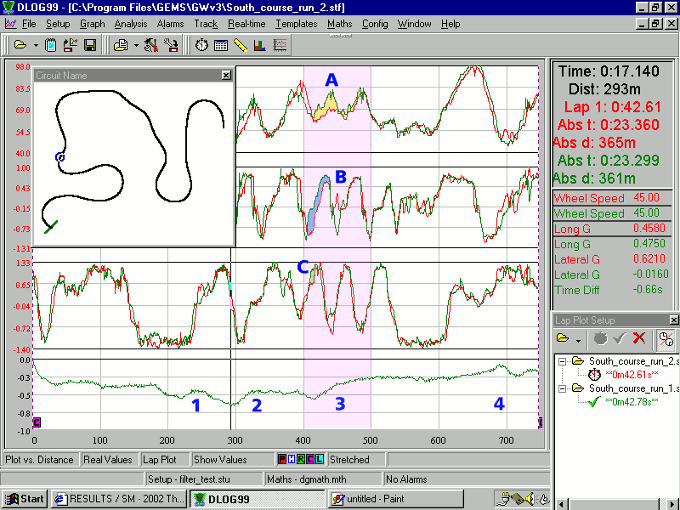
There's a lot of information here:
- The first three traces overlay run 1 (green) with run 2 (red) on a distance axis (in metres)
- Trace "A" is wheel speed in km/h
- Trace "B" is longitudinal acceleration in g
- Trace "C" is lateral acceleration in g
- The last trace is differential time between the two runs. As the line slopes down, run 2 is gaining time on run 1. As the line slopes
up, run 2 is losing time to run 1. And where the line is flat, the two runs are equal; neither run is losing time to the other.
- A course map is in the upper left. A cursor (in blue) shows the track position of the main cursor (the black vertical line)
- The values of the traces at the cursor are shown at the far right.
The differential time trace is very useful, as it shows at a glance where one run is faster than the other (in terms of elapsed time) and by how much. At the position of the cursor, run 2 is 0.66 seconds faster than run 1.
Moving along the differential time trace, run 2 starts out faster than run 1, but then there are four places where run 2 slows down relative to run 1. Each of these is a "mistake" and represents an opportunity for improvement.
Furthermore, we can see that at one point, run 2 was an absolute 0.66 seconds faster than run 1. But we can also, by ignoring any places where the line slopes up, formulate a "best case" projection of how much faster run 2 could have been had only the improvements over run 1 been recorded.
This value approaches a full second. Applying it to the actual results projects a 48.2, which is only 3 tenths off the lead pace. While it is dangerous to assume that this extrapolation is completely valid, it certainly indicates that the time was out there. Radical improvements in absolute performance are not necessarily needed (although always welcome) Instead, not making mistakes would put the car on pace.
It now remains to determine what the mistakes that caused time to be lost actually were.
Rather than describe each mistake in turn, we'll concentrate on the worst one - mistake "3", highlighted on the traces.
Mistake 3 starts at cone #75. The lateral g trace (point C) reveals that the G peak occurs fractionally later in run 2 than in run 1 (the difference is highlighted in light green). Following this, the longitudinal g trace (point B) rises later than run 1 and does not reach the same peak. (the difference is shown in light blue). As a direct result, the speed through this section is very much slower on run 2 (highlighted in light yellow, point A) and the run does not recover until cone #78.
Looking slightly earlier, it can be seen that a good deal more speed was carried out of the turn preceding the #75 cone on run 2, but that the brakes were applied later and less sharply (look at the longitudinal g trace). Turn-in for cone #74 starts at the same place, but the g peak is lower (indicating understeer). This throws the car slightly off line, and delays throttle application, reducing the speed at which the car arrives at cone #75. Again, the turn-in point (for cone #75) is nearly the same in each run, but the G peak in run 2 occurs later, again, indicating understeer (or in this case, less trailing-throttle oversteer, the effect of which increases with speed).
Run 1 actually carries so much speed past cone #75 that a brief brake application is required to make the following turn, but run 1 still enters the next section at a slightly higher speed than run 2 and so continues to make up time. Furthermore, the late g peak in run 2 past cone #75 pushes the car further off line, so that a larger turn (more lateral G) is required to make it around cone #76.
By cone #78 run 2 has recovered and the two runs are equal entering the following sweeper.
Thus, two issues are revealed:
- Late on the brakes entering the slalom, resulting in late throttle application
- Sluggish turn-in that depends on lift throttle oversteer to rotate the car (which works better at higher speeds)
Issue 1 may be as much a driver issue as a technical one (although brakes with more power may give the driver more headroom to recover from a missed braking point) but Issue 2 is definitely a car setup problem. Using lift-throttle oversteer to rotate the car (essentially, throwing the car into the turn) may work when entry speeds are high enough to pull it off, but it leaves the car sluggish and slow to respond when there's not enough momentum to rotate the car. It's also possible that when speeds get high enough, too much lift-throttle oversteer may be snapping the car around faster than can be compensated for by the driver, resulting in spins.
The solution is to get the front end of the car to respond quicker. Improve turn-in and initial rotation, and the driver will not feel the need to throw the car into the turn. Furthermore, small mistakes that scrub off the momentum that the toss-the-car style relies on will not be so punishing. The car should become more responsive and easier to drive - with an attendant increase in cornering speeds.
A first-principles analysis of chassis properties has revealed where the deficiency likely lies, and that is being incorporated into the 2003 setup.
2010 Comment This article was written shortly after I arrived back home from Nationals 2002. As can be gleaned from the Race Diary Entry I was not a happy camper at all. At issue was the fact that not two days previous, I had won both the Street Modified ProSolo Championship and the Honda Street Challenge and had made it look easy - same weather, same surface, same tires. And what had been just a beautifully handling car went to pot, snap-spinning on the first run and otherwise behaving very very badly.
This event, coupled with a long conversation with Carroll Smith, is what really started me along the road to professionalism in race car development. The suspension modelling, the shock dynoing (and subsequent development) and most of the revelations in Autocross to Win date back to this analysis.
And as it happens, the analysis was right. Modelling of the car revealed an excessively high rear natural frequency and dynoing the shocks revealed massively excessive rear shock force, particularly in compression, coupled to a low front natural frequency and mismatched valving. Changing spring rates and matching the valving created a car that would both turn in and rotate, with no more surprise snap-spins.
Key to all this was the fact that I had a chassis logger in the car that captured this data for later analysis. I still have all the data and can revisit it whenever I want. If you aren't doing this... why not?